
This is the article no one asked for, yet it’s the one you’re getting. You’re welcome (or, I’m sorry).
Tonight, Monday, June 22, 2026, 100-or-so high school students will gather in New York to compete for eternal glory (and college scholarships). May I present to you the Jimmy Awards – The National High School Musical Theatre Awards – aka the Tonys for American high school students.
The format has changed a bit over the years, but as it stands today, here’s how it works. Various state-level organizations host their own awards ceremonies, and the Best Actor and Actress winners are sent to New York for a chance to compete against the other winners, on a Broadway stage, none the less! Throughout a weeklong extravaganza of evaluations, rehearsals, and general theatre-kid debauchery, judges select semifinalists to be eligible for the overall Best Actor and Actress Awards. These semi-finalists are placed into coveted ‘character medley’ groups for the final show (this year hosted by Bowen Yang!), where the contestants perform snippets of their nominated role, fully in costume, alongside characters from other shows. There’s something both unsettling and magical about seeing 4 Tevyes sway in the background to The Surrey with the Fringe on Top from Oklahoma! From these character medley, 6-8 finalists are selected, who then go on to perform solo songs of their choosing (mostly – from a pre-approved list), and from that pool, 2 winners are selected.
With the 2026 Jimmy Awards coming up in a few short hours, I decided to do the lord’s work and analyze the past 16 years of Jimmy’s (using Claude, of course). What shows were popular 10 years ago, vs now? How about statistics like where nominees come from, or which nominees grew up to be bonafide Broadway stars? All questions that I will answer in this very important piece of theatrical journalism.
Overall Stats
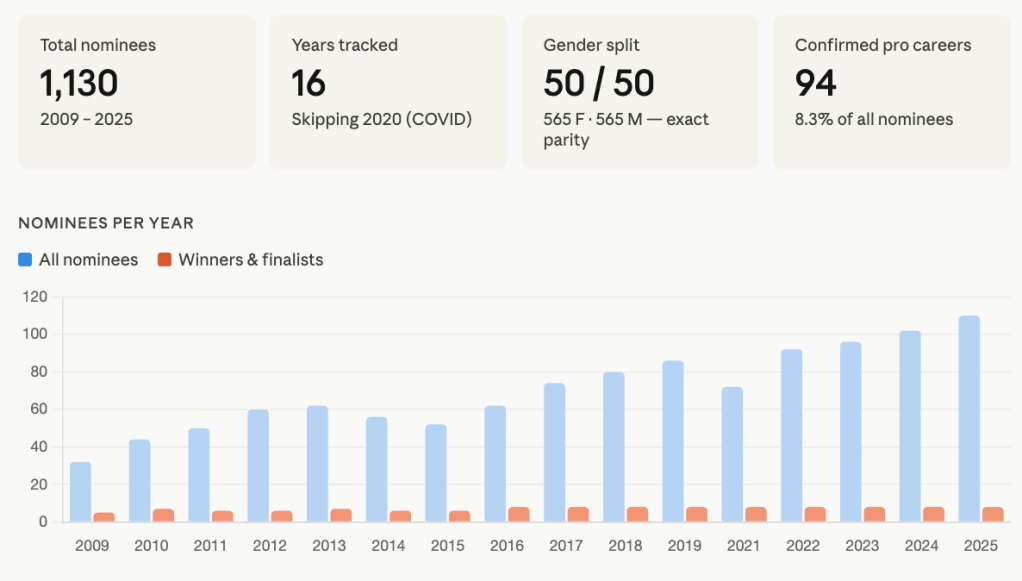
From 2009-2025, the program tripled in size – going from 32 nominees to 110:
State Representation – can state predict winners/finalists?
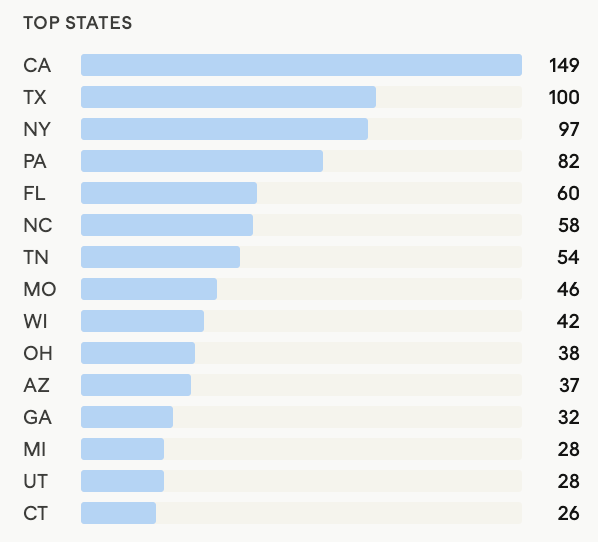
32 states are represented, though California, Texas and New York are overwhelmingly dominant (by number of nominees):
Some states perform better than others. The chart below shows which states produce the most finalists & winners (“Elevation Rate”), limited to states with 5+ nominees, so small samples don’t dominate:
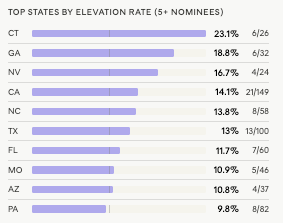
As you can see, Connecticut leads with 6 finalists/winners out of 26 total participants. Surprisingly, New York underperforms. Despite having 97 nominees, only 7 have been finalists or winners. These findings are descriptive, not predictive – the chi-square test returned p = 0.63 (i.e. there’s no statistically significant difference in elevation rates across states).
Professional Career Breakdown – are winners/finalists more likely to go pro than other nominees?
Some of my favourite competitors-turned-stars over the years include:
- Andrew Barth Feldman (Broadway, movies, music)
- Renée Rapp (Music, Broadway, TV, movies)
- Eva Noblezada (Broadway)
- Julia Knitel (Broadway, Tony nominee)
- Kyle Selig (Broadway, very attractive)
- Ryan McCartan (Broadway, TV)
- McKenzie Kurtz (Broadway)
- Jasmine Amy Rogers (Broadway)
- Antonio Cipriano (Broadway, TV – Off Campus, anyone?)
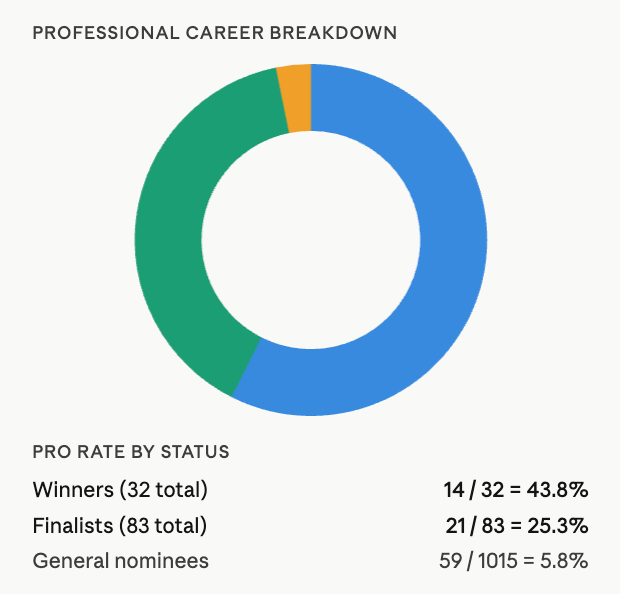
As shown in the previous chart, 94 participants (8.3%) have confirmed pro careers (defined as having professional performance credits on Broadway or on National Tours). Of the 94 professionals, 14 were Jimmy Award winners, 21 were finalists, and 59 were general participants:
It seems like winners & finalists are more likely to go pro than the general pool, but is this statistically significant? In short – mostly yes! I ran a few tests, so I’ll show you the charts, and then explain below what they mean.
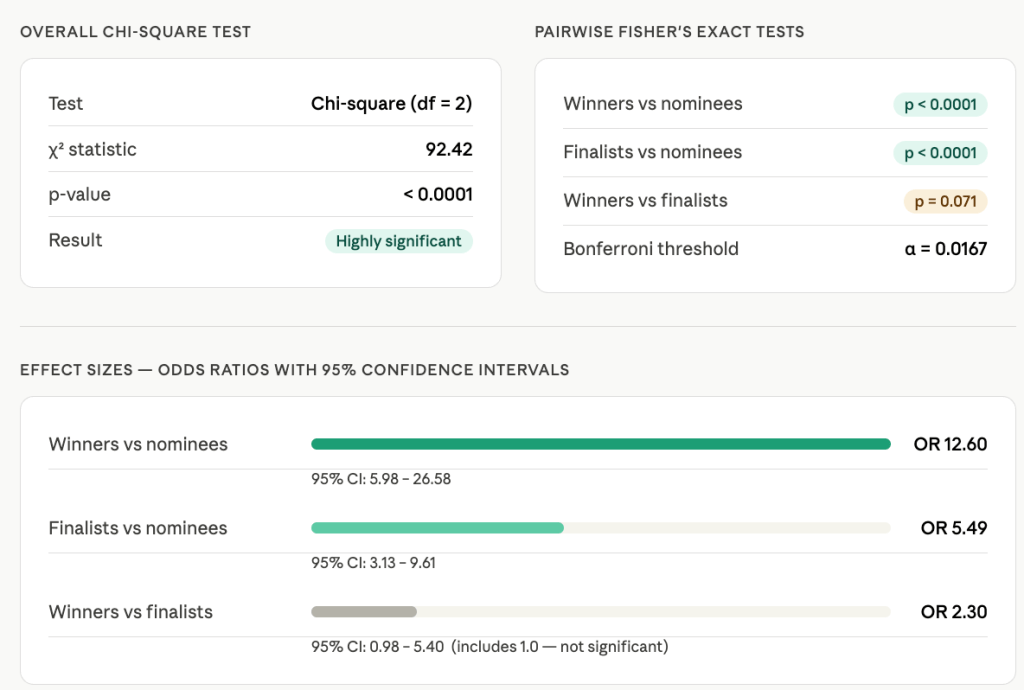
The overall chi-square test tells us that the picture is unambiguous – i.e., being a Jimmy winner or finalist is a high predictor of whether or not someone goes pro. A winner is about 12.6x more likely to become a professional actor than a general nominee, and a finalist about 5.5x more likely. However, with only 32 winners in the dataset, we can’t prove at the 95% confidence level that being a winner over a finalist independently predicts a pro career (that’s what the yellow highlighted p-value shows).
Nominated Shows & Roles over Time
Over the past 16 years, 210 unique shows have sent competitors to the Jimmy Awards:
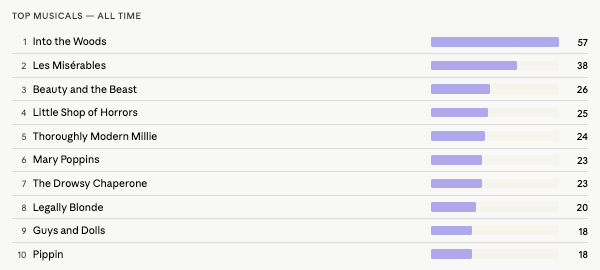
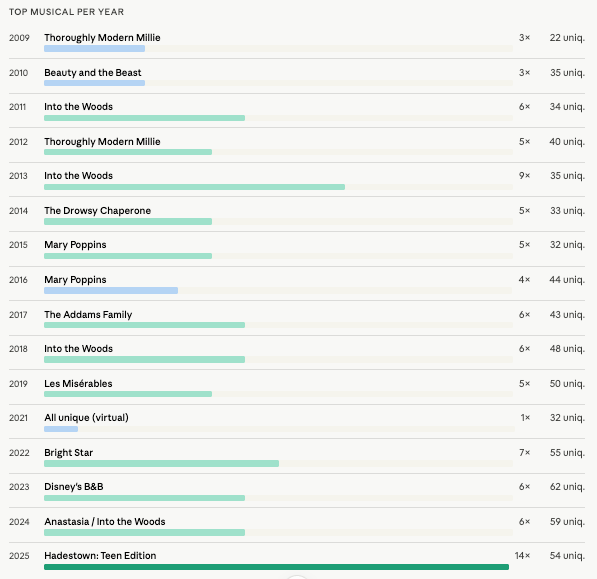
Interestingly, Hadestown only became eligible for licensing in 2025, and it sent 14 nominees last year (13% of the whole cohort). The previous single-year record for one show was Into the Woods in 2013, with 9 nominees. She’s a popular one.
Show Representation (or under-representation):
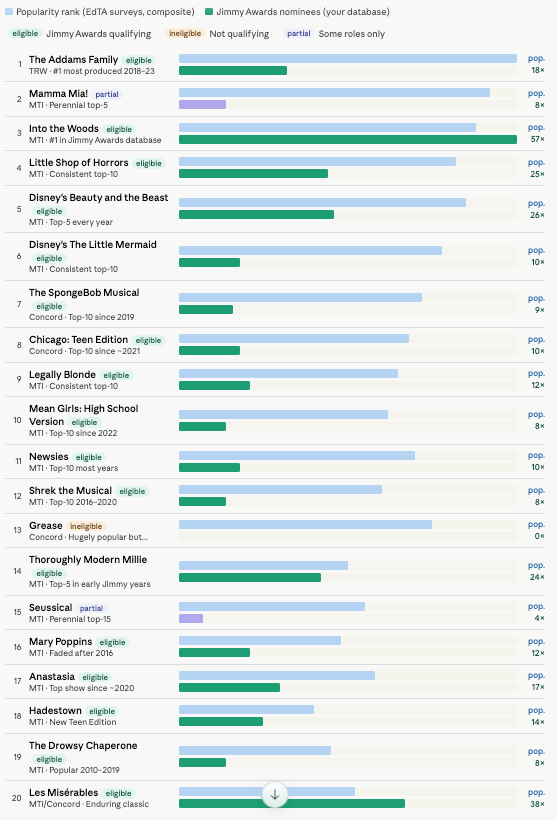
I compared show appearances in Jimmy Awards in relation to overall popularity of how often they’re licensed by high schools in the U.S. (EdTA survey). Some interesting findings:
- Grease is consistently one of the most produced high school musicals in the U.S., but it’s not Jimmy Award eligible (presumably due to licensing issues).
- Into the Woods is the 3rd most produced show nationally, but the single most represented in the Jimmy’s (57 nominees). In short: it’s punching above its weight.
- Mamma Mia! underperforms at the Jimmy’s – it’s the second-most produced musical, but has only been nominated 8 times. Perhaps the roles in this show are not the best showcases for the talent.
Now let’s look at specific roles within these shows, and discuss:
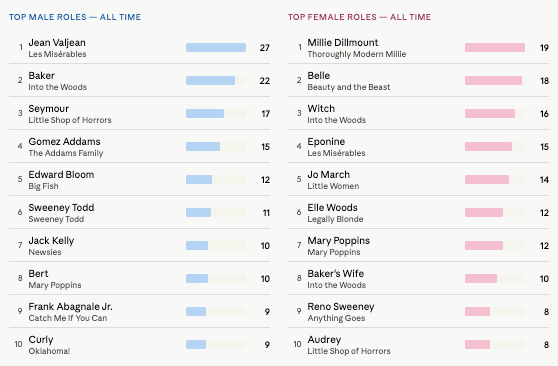
Jean Valjean is the undisputed king of male roles – 27 appearances across nearly every year of competition. Interestingly, though, two versions of Les Mis are licensed – the full version and the school version. The standard Les Mis has produced 4 finalists; the school edition has produced none. Maybe this is an indication of the calibre of talent that participates in each version of the production. Additionally, Gomez Addams from The Addams Family and Sweeney Todd from Sweeney Todd have each received 11 nominations over time, but none of these shows have produced a finalist or winner.
On the female side, Millie from Thoroughly Modern Millie was popular in the early years of competition (in 2011 alone there were 5 Millies nominated), and has tapered off in recent years. It’s also worth noting that Belle from Beauty and the Beast has had 14 nominees over the years (the second most nominated female role of all time), but has not produced a single finalist or winner.
Predicting finalists & winners based on show
Into the Woods is the most represented show of all time, sending 57 nominees, yet it has only produced 1 winner. Meanwhile, a show like Big Fish, with just 15 nominees, has produced 3 winners. Despite being called “Big Fish,” she is, indeed, a dark horse. Let’s dive deeper:
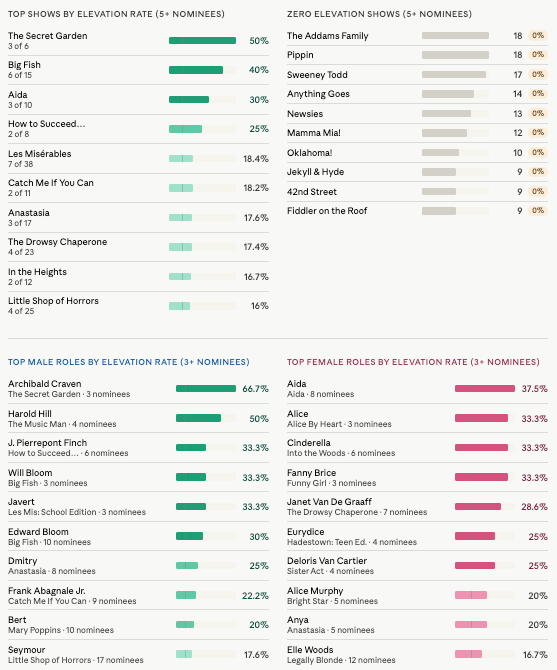
To clarify, “elevation rate” refers to the percentage of nominees from a given show or role that become finalists or winners. E.g. The Secret Garden sent 6 nominees of the year, of which 3 were “elevated,” so the elevation rate is 50%. “Zero elevation” means that no finalists or winners have come from these shows. The p-value for shows with 3+ nominees was 0.185 – still non-significant, though lower than the states’ p-value of 0.625, which suggests that *perhaps* show/role is a better predictor of elevation than state. Again, though, this is descriptive more than statistically significant, since the data pool is too small.
Looking Ahead
This year’s 116 nominees (up from 110 last year) come from 58 different regional awards across the U.S., representing 53 unique musicals, 9 of which are new this year:
- Water for Elephants
- Natasha, Pierre & the Great Comet…
- The Hello Girls
- Jesus Christ Superstar
- James and the Giant Peach
- The Theory of Relativity
- Between the Lines
- Come from Away
- Ride the Cyclone: Teen Edition
New states represented for this first time this year are: Alabama, Kentucky, Oregon, Nebraska, New Mexico, Rhode Island, and Idaho. California and Florida lead with 12 and 8 nominees, respectively.
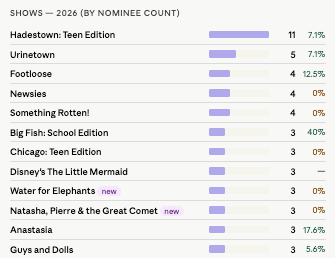
In terms of which shows reign supreme this year, here are the highest represented shows. The percentage indicates the historical elevation rate (e.g. for Hadestown, 7.1% of nominees from this show have previously become finalists or winners):
And taking a quick peak at the roles with the highest historical elevation rate:
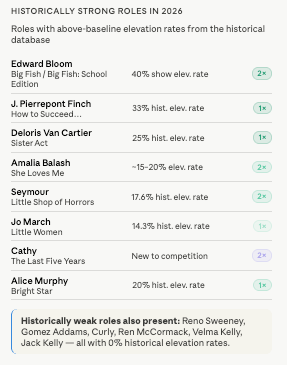
So, with all of this data inputted, can we predict who is likely to be elevated this year? Statistically-speaking: no. But just for fun, here are some guesses. I know none of these performers, have never seen them perform, and am basing this purely on historical trends. I’ve excluded the individual performers’ names and only refer to them by their character and state (because they’re high school students), but you can find a full list of nominees here.
Best Actor
- Edward Bloom, Big Fish, CO: Big Fish has the highest elevation rate out of any show with meaningful volume (40%). This role specifically has produced 3 winners and 3 finalists. The Bobby G Awards in Denver has a pretty good track record. An actor from Oklahoma is also nominated for this role, and historically, when two nominees have shared a role, 21.3% of those groups produce at least one elevated nominee, which is nearly double the individual rate. But if one of the nominees advances, the other almost certainly doesn’t. So we’ll see!
- J. Pierrepont Finch, How to Succeed…, DC: This show has an 18.2% elevation rate and has produced two winners (Ryan McCartan & Taylor Varga).
- Carl Hanratty, Catch Me If You Can, MI: another 18.2% elevation show with a winner (Andrew Barth Feldman). Both J. Pierrepont & Carl are charming roles, and Carl in particular requires strong vocals. This seems like judge catnip.
- Seymour, Little Shop of Horrors, MO: Seymour has a 17.6% elevation rate, and the Ken Page Awards has a decent track record.
Best Actress
- Celie, The Color Purple, GA: another big role, plus Georgia historically over-performs.
- Alice Murphy, Bright Star, AZ: this performer is a 2x Jimmy Awards finalist, and this role has a 20% elevation rate.
- Lilli Vanessi/Katharine, Kiss Me, Kate, FL: 33.3% role elevation rate, plus Florida is a strong state.
- Alice, Alice by Heart, TX: another 33.3% role elevation rate, and Texas is a solid state. This show/role produced a winner in 2024 (Gretchen Shope).
You’ll be able to live stream the event at 7:30 PM on Youtube at this link. I hope you’ll tune in! I know I will 🙂
